

This is a tree diagram showing how each KPI (Key Performance Indicator) is related and connected to the KGI (Key Goal Indicator).
It helps the entire store understand which KPIs need improvement to achieve the KGI.
KPI Tree Aligned with Sales Goals
By default, the KPI tree for [Today], [This Week], and [This Month] is displayed based on each target sales.
The comparison period is always the immediately preceding period.
[Today] e.g. Mon, Jul 15, 2024 → comparison period: Mon, Jul 8, 2024
[This Week] e.g. Sun, Jul 14 – Sat, Jul 20, 2024 → comparison period: Sun, Jul 7 – Sat, Jul 13, 2024
[This Month] e.g. Mon, Jul 1 – Wed, Jul 31, 2024 → comparison period: Mon, May 27 – Wed, Jun 26, 2024
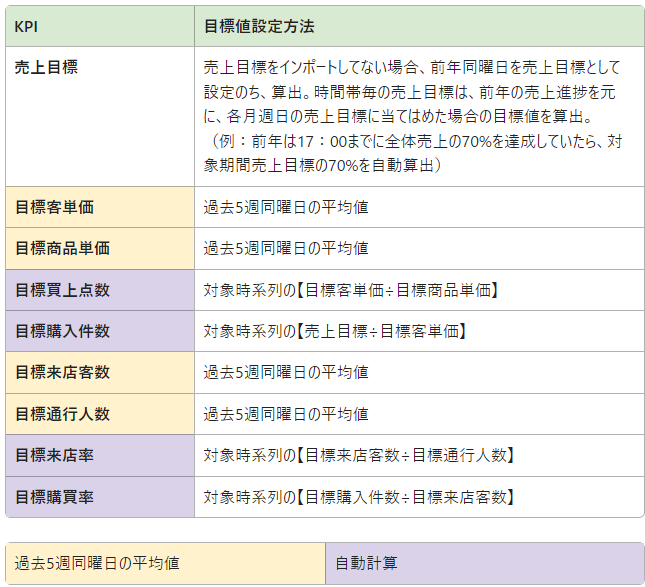
The target values for each KPI to achieve the goal are automatically calculated according to the progress of the target sales.
The calculation method for the target KPIs is specified below.
Calculation Method for Each KPI Target Value
Freely Selectable KPI Tree
※As a new development, we will report to you as soon as we are ready to guide you. (August 2024)
Back-calculating to Achieve Target Sales with KPI Tree
Once you understand the structure of KGI and KPI, calculate how much each KPI needs to be increased to achieve the target sales.
If sales are 20% short of progress, identify the most critical KPI in the tree and work on improving actions.
Are the actions to increase each KPI clear?
Set target action numbers and aim to increase the current action numbers by 20% to boost sales.
That's all. If you have any questions, please contact us at ([email protected]).