We will introduce the various features available in the attribute report.
By switching the values/percentages of each graph, you can view the estimated actual values and ratios.
*Please note that the estimated actual values for the number of visitors and attribute values may differ depending on the sensor system.

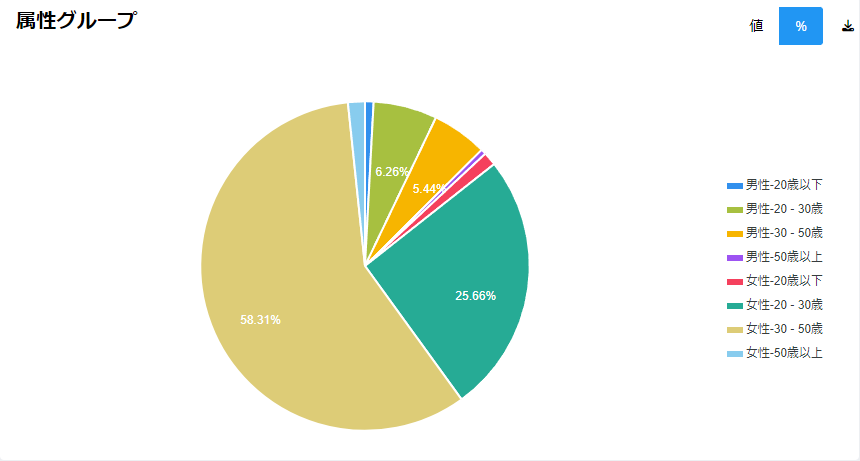
In the Attribute Group, the attribute data obtained from the camera is broken down into graphs by [Gender] and [Age Group].
This is the report that displays the obtained data in the most detailed manner.
You can check the displayed age range using the legend located on the right side of the image above.

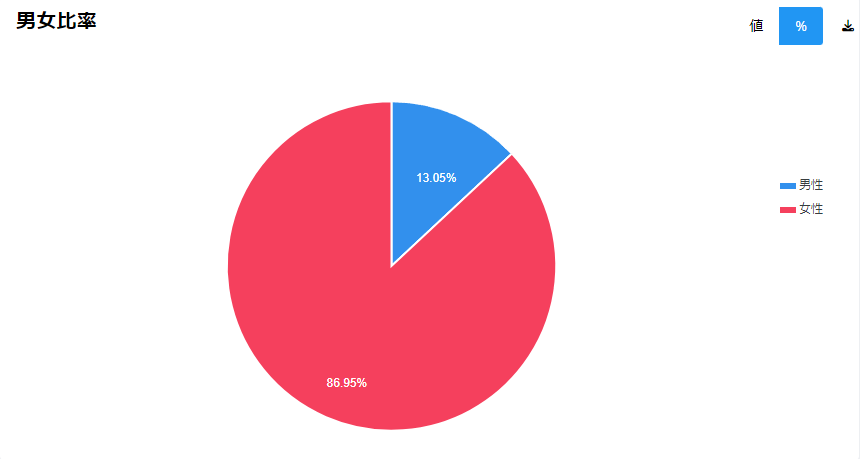
The gender ratio graph focuses on the 'gender' attribute data that has been collected.
You can check the displayed genders using the legend located on the right side of the image above.
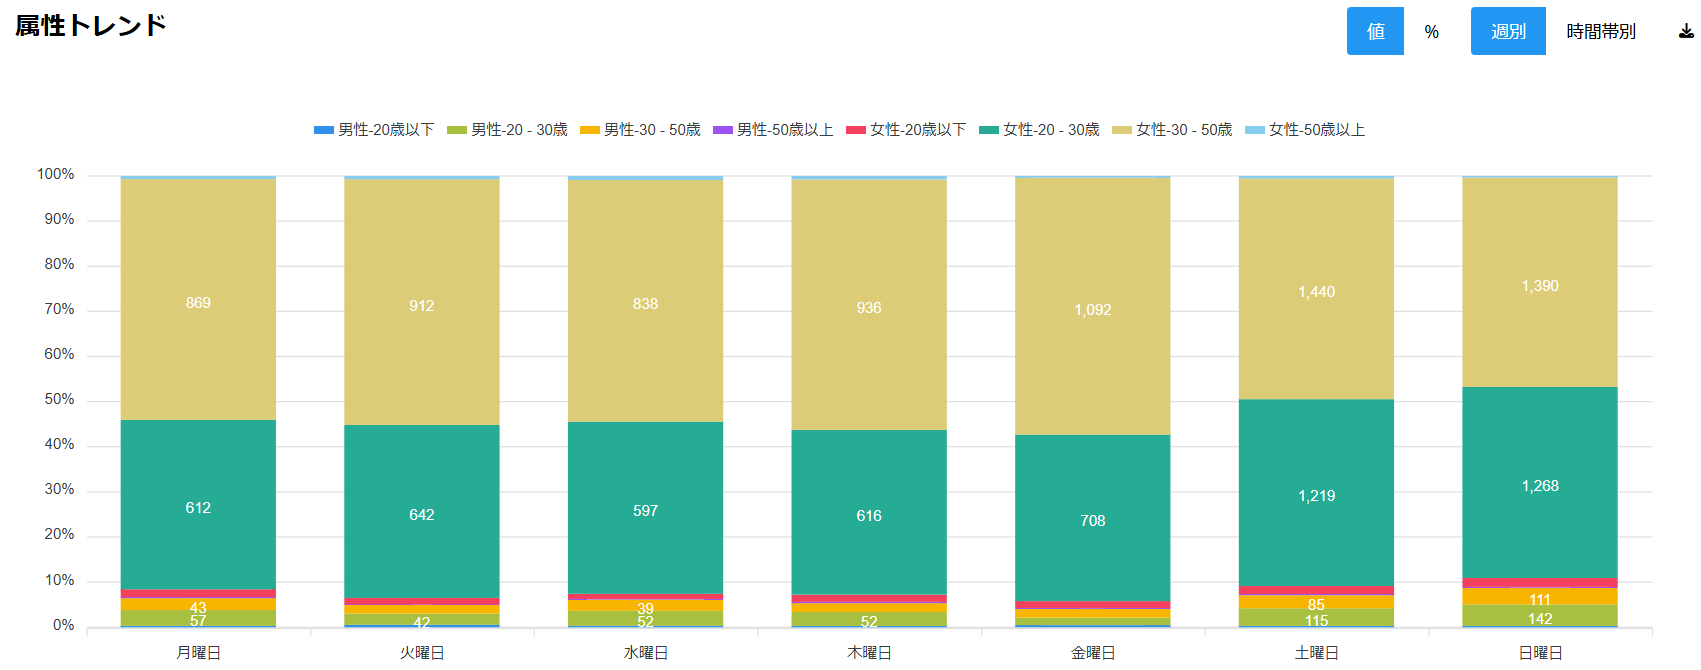
The attribute trends report visualizes the collected 'gender' and 'age group' data, further broken down by 'weekly' and 'time of day' segments.

The weekly report displays data for the selected period by day of the week.
By displaying data on a daily basis, you can check the ratio of weekday to weekend visitors.
You can check this by clicking the [Weekly] button located at the top right of the image above.

The time-based report displays the selected period data by time slots. (The displayed time slots vary depending on the store's business hours.)
By displaying data by time slots, you can check the attribute ratio of customers for each time slot.
You can check this by clicking the [Time-Based] button located at the top right of the image above.
If you want to export attribute data, you can download it from the [Attribute Report] in the menu bar.
For the download format, please refer to this article.