
The [Export] function allows you to download various data in the specified format.
Select [Tools] ⇒ [Export] from the menu bar.
The export screen will be displayed.
With the period filter, you can set the period of the data to be downloaded.
In addition, you can specify the period not just to this week or this month, but you can also select the period on the calendar as you wish.
Regarding the comparison period, the comparison period specified at the time of the introduction will be displayed.
By using the store filter, you download data from the store you specified.
The store can be specified by ticking the checkbox next to the store name.
With the KPI filter, you can set the KPI of the data to be downloaded.
KPIs can be specified from the checkbox next to the KPI name.
It is possible to specify the sort order of data in the sort selection.
Select the sorting items in the box on the left and the order (ascending/descending) in the box on the right.
The report type allows you to select the format of the data to be downloaded.
Please refer to the following items for each format
The all-store report shows data for the selected period, along with last week's results and last year's results, plus their ratios.
You can choose which KPIs are displayed under [KPI].
The summary report shows each KPI's results for the selected period, grouped by region, store format, AM, etc.
The displayed fields are the actual result, last week's result, last year's result, and their ratios.
You can choose which KPIs are displayed under [KPI].
The hourly report shows each KPI's results for the selected period, broken down by time slot.
(Example) If you select [Last Week] as the period
9:00 — shows the total (or average) of last week's data from 9:00:00–9:59:59
10:00 — shows the total (or average) of last week's data from 10:00:00–10:59:59
You can also choose which KPIs are displayed under [KPI].
The daily report shows each KPI's results for the selected period, broken down by day.
You can choose which KPIs are displayed under [KPI].
You can choose your preferred order under [Sort].
The all-store daily report shows daily data for the selected period, broken down by store.
You can choose 1 KPI to display under [KPI].
The attribute report shows the breakdown of attribute data for the selected period, by hour.
The attribute data breakdown is shown as [100% / 1 hour].
*The attributes shown vary depending on each client's measurement setup.
When downloading the report, the CSV file will contain the following columns:
Store Code - A unique identifier assigned to each store.
Store Name - The official name of the store.
District - The administrative division in which the store is located.
Region - A larger geographical area encompassing multiple districts.
Area Manager - The individual responsible for overseeing store operations within a specific area.
Peer Group 1 - A categorization of stores based on similar characteristics.
Peer Group 2 - An additional level of categorization for benchmarking purposes.
This Period Results - The store's KPIs data for the current reporting period, measured.
Previous Period - The store's KPIs data for the preceding reporting period.
YOY- Year-over-year percentage change comparing the current period to the same period in the previous year.
Previous Year Same Day of the Week- The store's KPIs data from the corresponding day of the week in the previous year.
YOY- The year-over-year percentage change calculated using the previous year's same day.
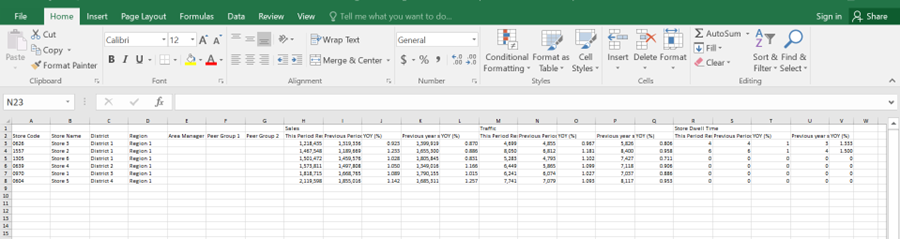
Detailed Report: includes store wise KPIs data with following columns Store Code, Store Name, District, Region, Area Manager, Peer Group 1, Peer Group 2, This Period Results, Previous Period, YOY, Previous Year Same Day of the Week, YOY. As shown in figure.
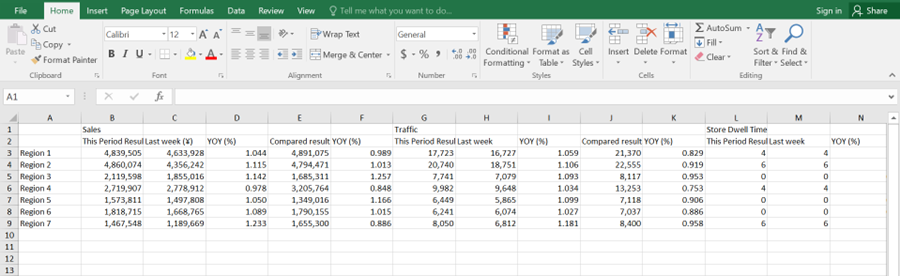
Summary Report: it includes region wise KPIs data with following columns Region, This Period Results, Previous Period, YOY, Previous Year Same Day of the Week, YOY. As shown in figure.
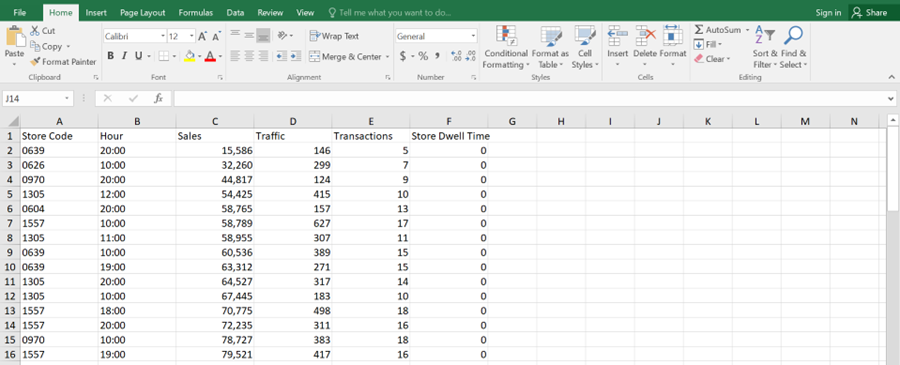
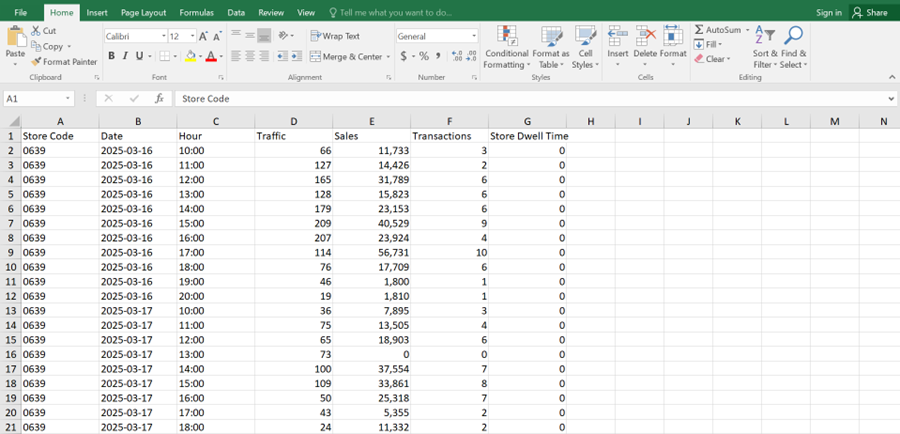
Hourly Report: it includes Store Code and hourly wise KPIs data with following columns Store Code, Hour and KPIs. As shown in figure.
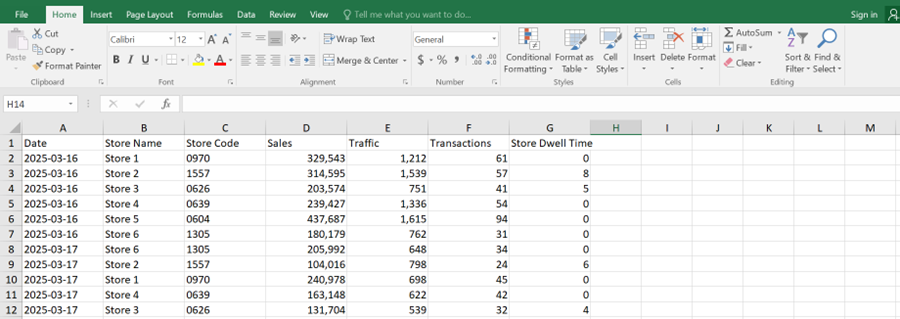
Daily Report: it includes daily KPIs data with following columns Date, Store Name, Store Code and KPIs. As shown in figure.
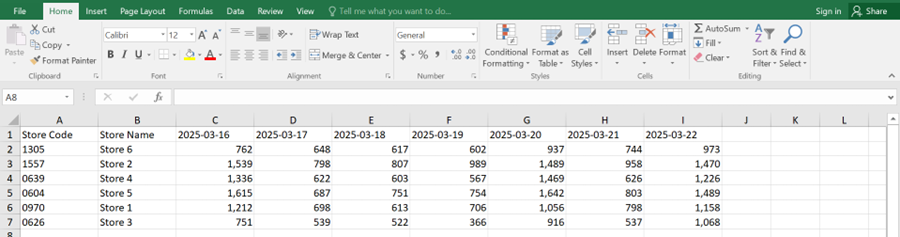
All Stores Daily: it includes date wise KPIs data with following columns Store Code, Store Name and Dates. As shown in figure.
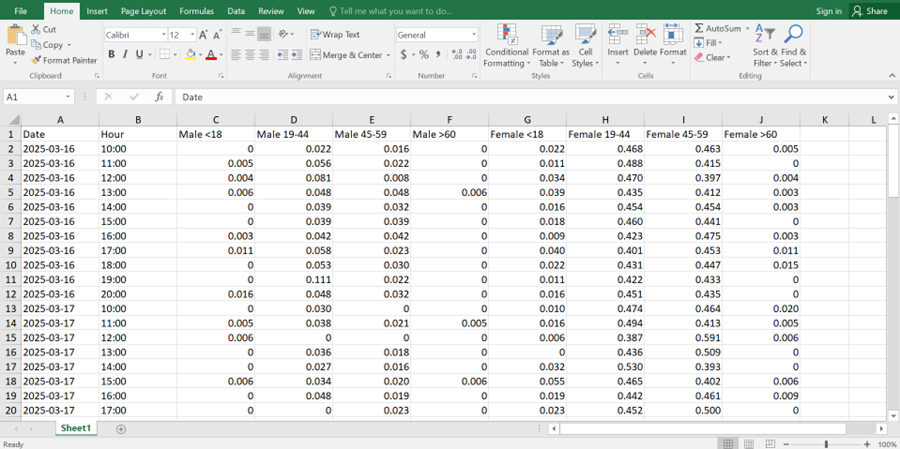
Demographics: it includes date and hour wise demographics data with following columns Date, Hour and Gender. As shown in figure.
Hourly Report by Store: it includes date and hour wise KPIs data with following columns Store Code, Date, Hour and KPIs.
If you have any questions or feedback, please contact support at [email protected].
