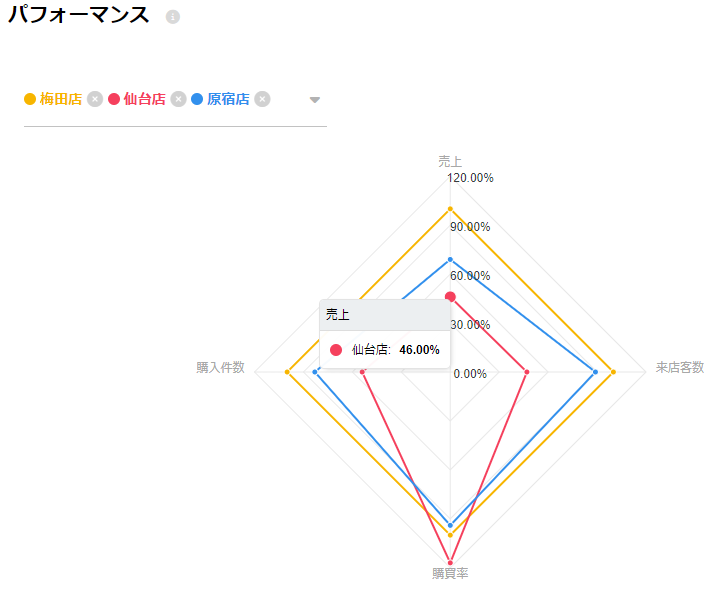
You can compare the KPIs of up to 6 selected stores in the location comparison.
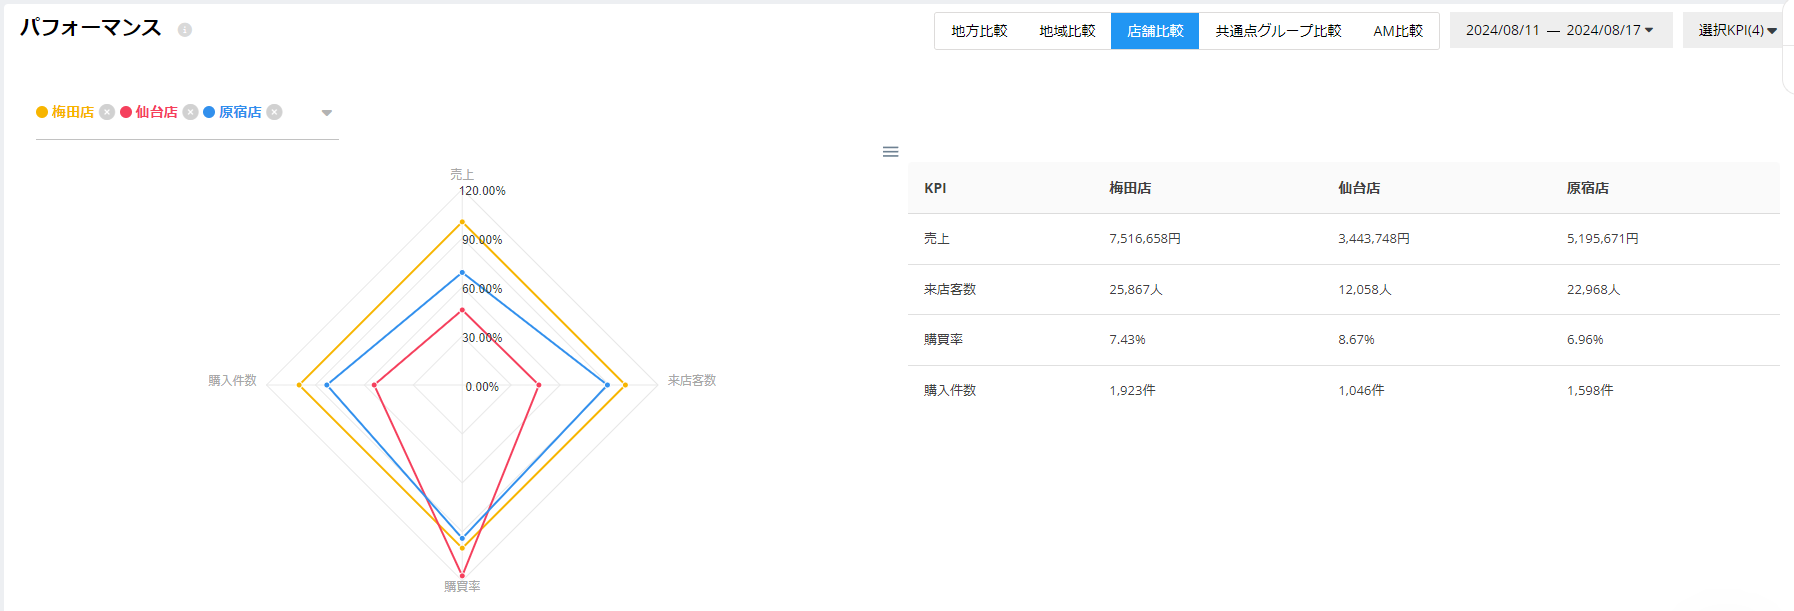
The first selected store (yellow) is set as 100%, and the ratios of each store are graphed based on this.
By comparing rival stores and similar stores, and understanding the characteristics of KPIs, it is possible to improve the quality of communication between stores.