Introduction
This document provides a step-by-step guide
on how to download reports using filters. The process ensures that users can filter
their data selection before exporting the reports.
Open the application and go to the 'Tools' section.
Locate the 'Data Export' option available within the Tools section.
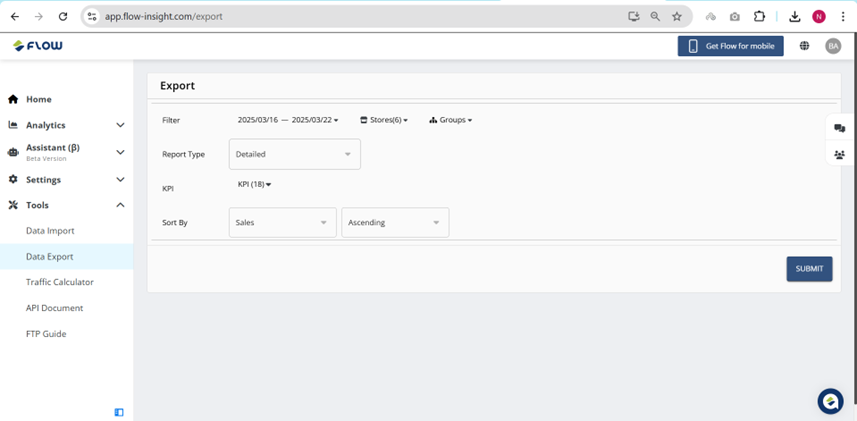
Select the appropriate filters to refine the report.
Options include:
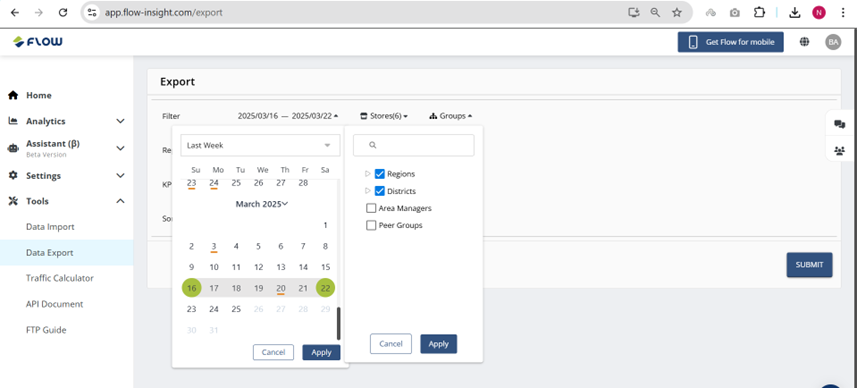
Date range (From – To)
Stores List
Groups List (Regions, Districts, Area Managers, Peer Groups)
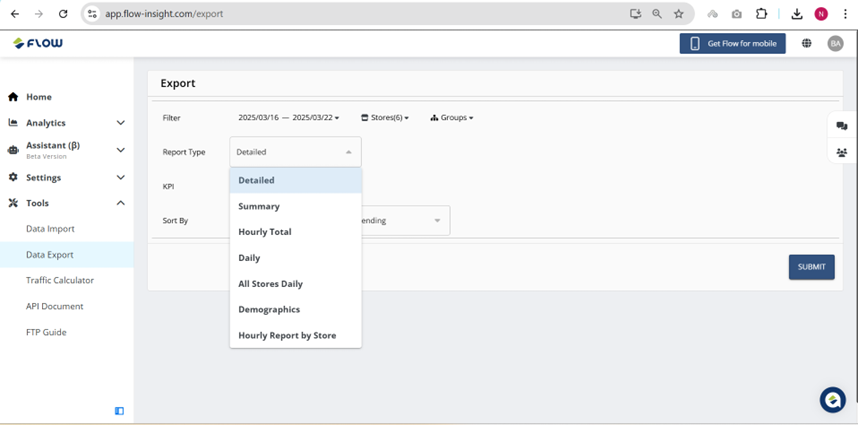
Reports Type (includes 7 types of reports)
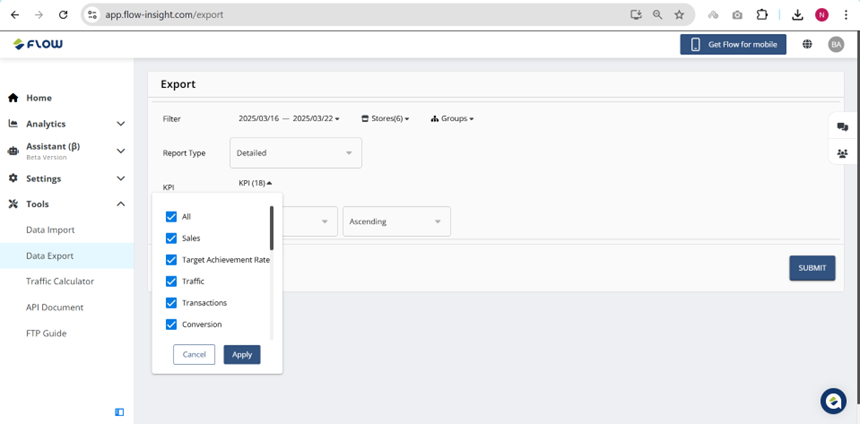
KPI (All assigned KPIs)
Sort By (KPIs and other possible filters)
Ascending/Descending option
Refer to the screenshot below for the filter selection interface.
Once the filtered data is selected, click on the 'Submit' button.
The system will process the request and generate the file.
File will be downloaded in CSV Format.
When downloading the report, the CSV file will contain the following columns:
Store Code - A unique identifier assigned to each store.
Store Name - The official name of the store.
District - The administrative division in which the store is located.
Region - A larger geographical area encompassing multiple districts.
Area Manager - The individual responsible for overseeing store operations within a specific area.
Peer Group 1 - A categorization of stores based on similar characteristics.
Peer Group 2 - An additional level of categorization for benchmarking purposes.
This Period Results - The store's KPIs data for the current reporting period, measured.
Previous Period - The store's KPIs data for the preceding reporting period.
YOY- Year-over-year percentage change comparing the current period to the same period in the previous year.
Previous Year Same Day of the Week- The store's KPIs data from the corresponding day of the week in the previous year.
YOY- The year-over-year percentage change calculated using the previous year's same day.
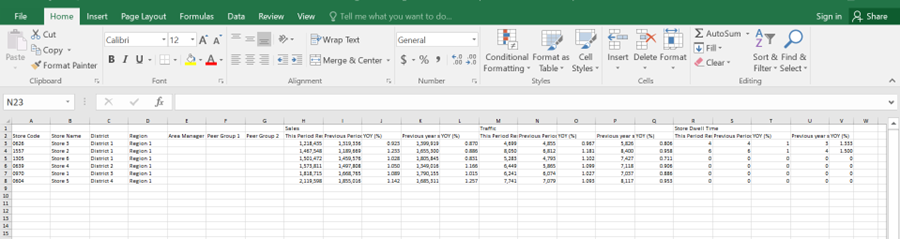
Detailed Report: includes store wise KPIs data with following columns Store Code, Store Name, District, Region, Area Manager, Peer Group 1, Peer Group 2, This Period Results, Previous Period, YOY, Previous Year Same Day of the Week, YOY. As shown in figure.
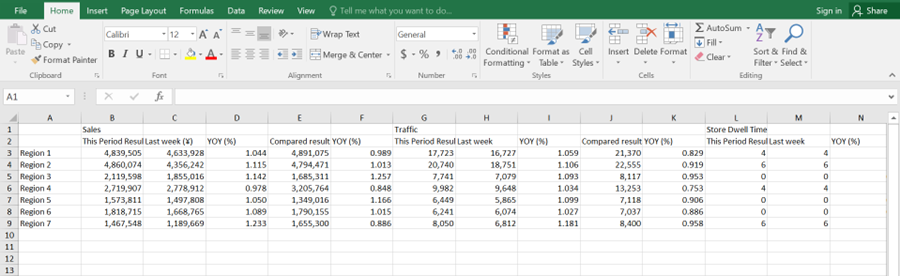
Summary Report: it includes region wise KPIs data with following columns Region, This Period Results, Previous Period, YOY, Previous Year Same Day of the Week, YOY. As shown in figure.
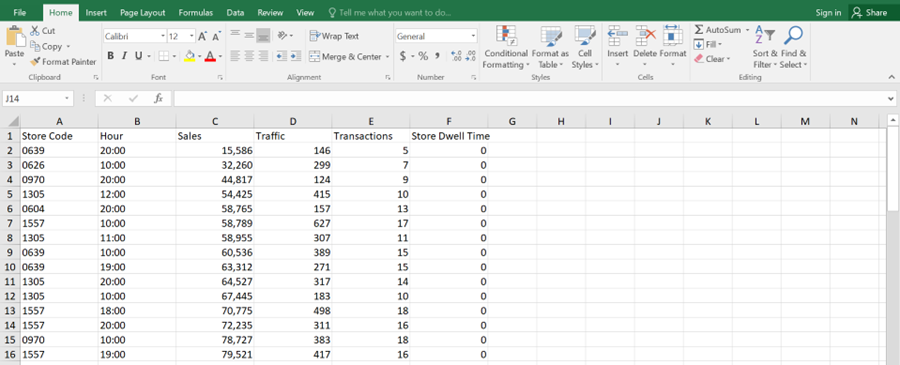
Hourly Report: it includes Store Code and hourly wise KPIs data with following columns Store Code, Hour and KPIs. As shown in figure.
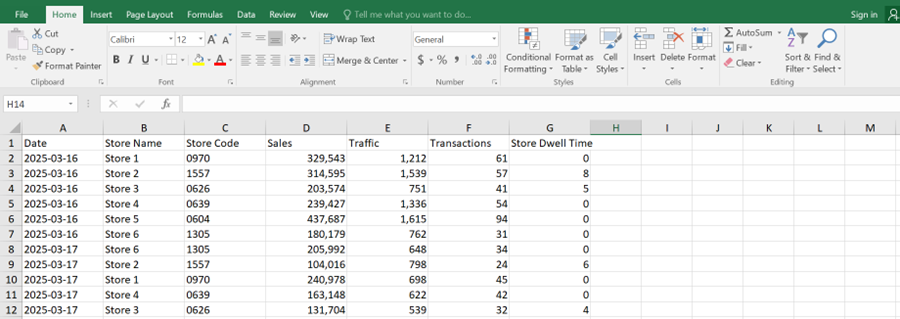
Daily Report: it includes daily KPIs data with following columns Date, Store Name, Store Code and KPIs. As shown in figure.
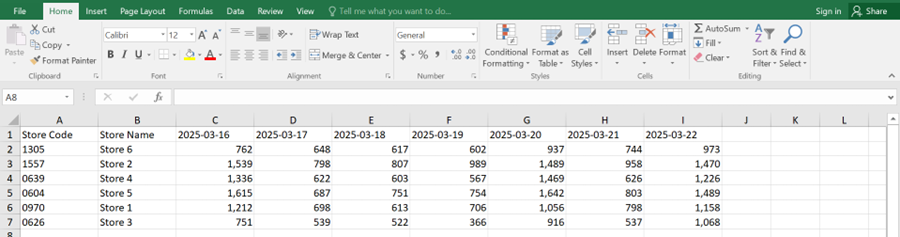
All Stores Daily: it includes date wise KPIs data with following columns Store Code, Store Name and Dates. As shown in figure.
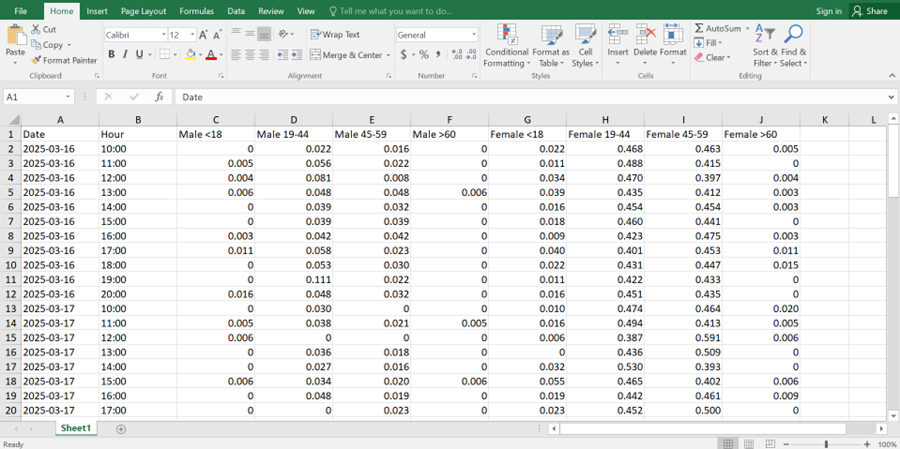
Demographics: it includes date and hour wise demographics data with following columns Date, Hour and Gender. As shown in figure.
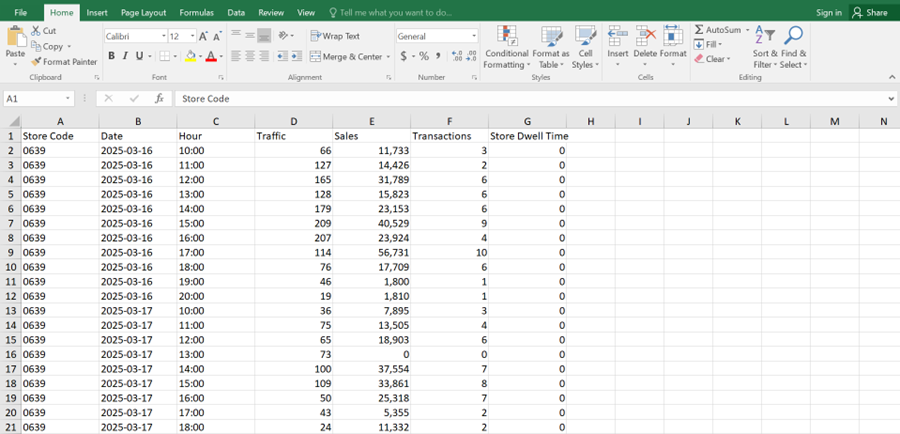
Hourly Report by Store: it includes date and hour wise KPIs data with following columns Store Code, Date, Hour and KPIs.
Following these steps ensures an efficient and accurate report generation process. Properly utilizing filters helps in retrieving relevant data, improving analysis and decision-making.
For further assistance, contact the support team.