
Introducing the various features available for use in 【Store Visit Trends】.
You can check the number of visitors, average stay time (optional), and the 7-day visitor forecast.
Click each card to view the data by day or time period for the selected period.

With the sensor's optional features, it's also possible to display the average dwell time.Measurement Devices

The 7-day visitor forecast is a report that displays projected visitor counts for the next week, including today, in a graph.
It refers to and displays average values based on past data.
You can export graph images and data using the download button in the top-right corner of the report.

In Power Hour, you can check customer visit trends for each day of the week.
The color chart shows an increase in customer visits, ranging from light blue to dark blue.
It enables you to visualize setting shifts, break times, and business opportunities.
Additionally, you can select the data to reference from the red-framed area in the image above.
Real Value: Displays the hourly customer count using real values. Time periods with increased customer counts on all days are shown in dark blue.
% Per Day: Converts the customer percentage for each day to 100% and displays the proportion of customers by day. When a weekly period is selected, you can check the customer ratio by time period for each day.
% Weekly: Converts the customer percentage across all days to 100% and displays the customer proportion for all days. This feature allows you to identify time periods with increased customer counts during the week.
*If the selected period exceeds one week, the total for each day will be displayed.
The entrance displays the number of visitors counted at each store's entrance.
You can select the display format as [Average/Actual Numbers] or [By Day/By Timeframe].
By clicking the blue triangle on the left, you can view numbers for each store's entrance.
You can toggle the visitor numbers for each entrance between [In/Out].
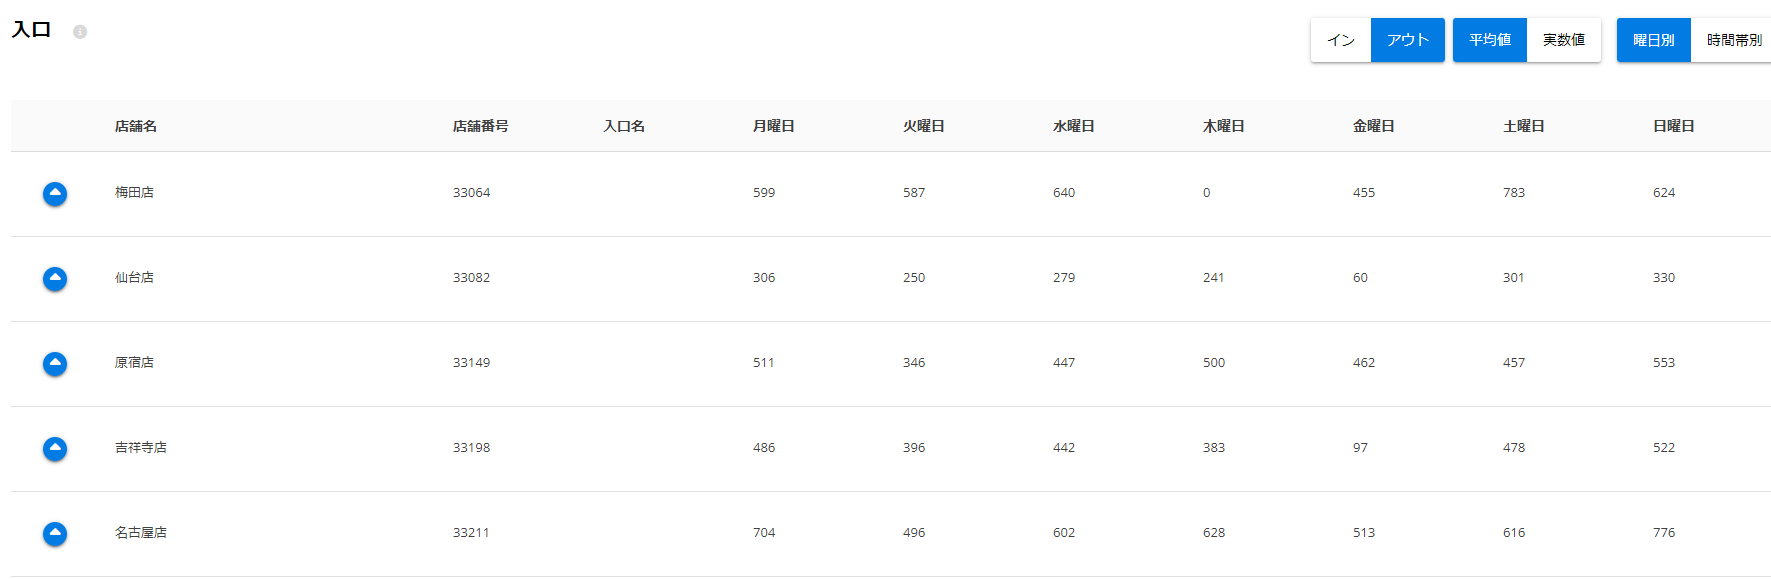
In: Represents the number of people entering, allowing you to identify which entrance has the most interest.
Out: Represents the number of people leaving, displayed by default as the value for 'number of visitors.' *For purchase rate consistency
Average: Displays the average number of visitors for each day of the week/time slot within the selected period set in the time settings.
Actual: Displays the actual number of visitors for each day of the week/time slot within the selected period set in the time settings.
By Day: Displays the average/actual number of visitors for each day of the week within the selected period set in the time settings.
By Time Slot: Displays the average/actual number of visitors for each time slot within the selected period set in the time settings.
Store visit trends: setting hourly budget and targets from visitor data
How to set hourly budget and targets based on visitor count trends.
Store visit trends: verifying the effect of entrance changes on visitor growth
How to verify the effect of entrance-focused initiatives using visitor count data.
If you have any questions or feedback, please contact support at [email protected].
