

Entrance-focused VMD initiatives — like product displays or mannequins — are one of the most effective ways to increase store traffic.
Analyzing the results of each initiative and applying what you learn to the next one lets you run the PDCA cycle faster.
This article walks through how to verify an initiative's effect using your traffic data.
Understanding entrance traffic: in vs. out
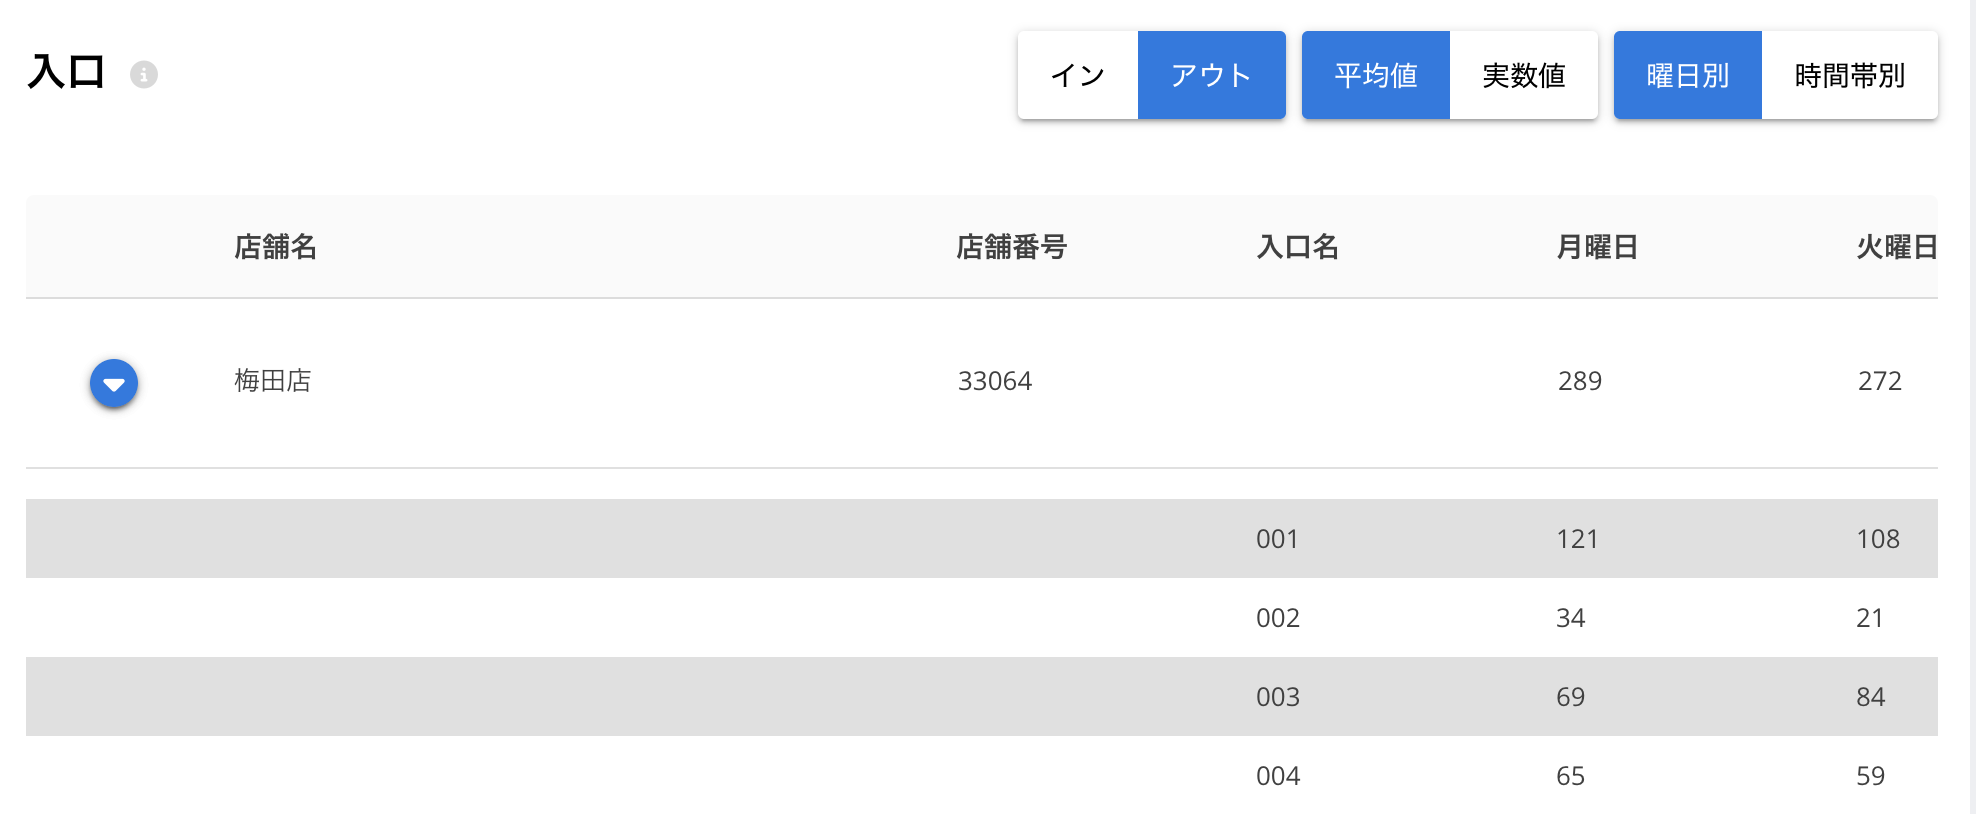
Traffic splits into "in" (customers entering) and "out" (customers exiting). When measuring VMD effectiveness, use the "in" count as your KPI.
In = customers entering
Out = customers exiting
Compare time-slot and day-of-week averages (or raw numbers) against last year or last week to spot trends.
"Out" can include staff seeing customers off at the exit, so it may not exactly match "in."
Our data shows capture rate tends to run higher on holidays and lower on weekdays.
Throughout this article, "traffic" and "capture rate" refer to the "in" figure — written as in-traffic and in-capture-rate.
Comparing entrances year-over-year and week-over-week
Use the export feature to build up daily/hourly data in Excel or CSV — this gives you more accurate year-over-year and week-over-week growth rates.
If you have multiple entrances
If the entrance where you changed VMD shows faster in-traffic growth (year-over-year) than your entrances overall, the change likely worked.
If you have a single entrance
Hypothesize effectiveness based on traffic growth vs. the comparison period, and check it alongside the featured product's inventory turnover.
If you also measure storefront passersby, look at capture-rate growth instead. Passersby and capture rate can swing due to store format or external factors, so track monthly/weekday/weekend/hourly averages to learn your normal range.
If you have multiple entrances and measure passersby
Calculate each entrance's capture rate and use it as your effectiveness KPI. Swings within your normal range are probably external factors — but if capture rate exceeds or holds above your usual range after the initiative, that's a sign it worked.
Setting a concrete target — like "+20%" — makes it easier to plan budgets and course-correct later.
Combining traffic/capture-rate growth with the featured product's inventory turnover gives you a fuller picture of how well a VMD initiative performed.
That's all for this guide. If you have any questions or concerns, please contact us via chat on the support page, or at [email protected].