
Sales are composed as shown in the following diagram.
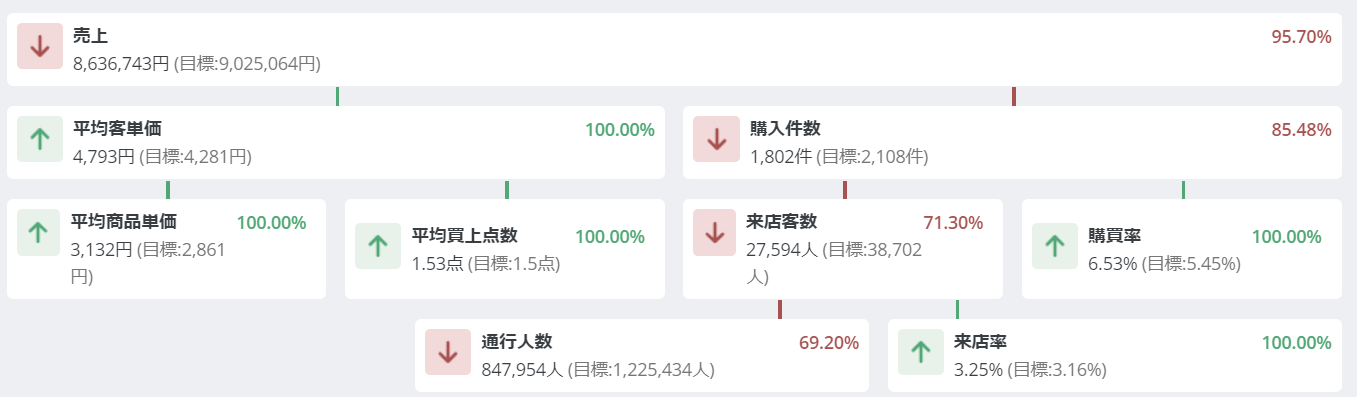
Sales are composed by multiplying each KPI, and by analyzing each KPI, it is possible to maximize sales or identify factors of poor performance.
When setting target KPI numbers based on the store budget, the following figures can be considered as reference.
・Actual figures from the previous year, comparison rate with the previous year's figures against the budget (%)
・Actual figures from the previous month, KPI increase/decrease rate from the previous month (%)
・Trend values
We will guide you through some target setting scenarios based on the above reference values.
For each store, the target purchase numbers are calculated using the average customer unit price for the same period of the previous year from the set monthly and quarterly budgets.
(Example) ¥1,000,000 ÷ ¥6,000 = 167 (cases)
Calculate the reference value for the target KPI against the budget by multiplying the comparison ratio with the previous year's sales performance and the previous year's KPI figures.
(Example) ¥1,000,000 ÷ ¥800,000 = 125%
200 (purchase cases) ✕ 1.25 = 250
* The KPI item to multiply the comparison ratio with should be either the number of purchase cases or the average customer unit price, and apply the comparison ratio similarly to the KPI related to each KPI to calculate the reference value.
By reflecting the trend values of recent past data in the figures for the same period of the previous year, it is possible to calculate reference figures that match the current performance trends for target values.
(Example) Purchase count comparison rate from the previous month to the previous year: 110%
Customer unit price comparison rate from the previous month to the previous year: 95%
200 (purchase count for the same period last year) ✕ 1.10 = 220 (items)
¥6,000 (average customer unit price for the same period last year) ✕ 0.95 = ¥5,700
※ From the calculated figures, further multiply by the comparison rate of the budget and the previous year's sales to calculate the target reference figures for the specified KPI.
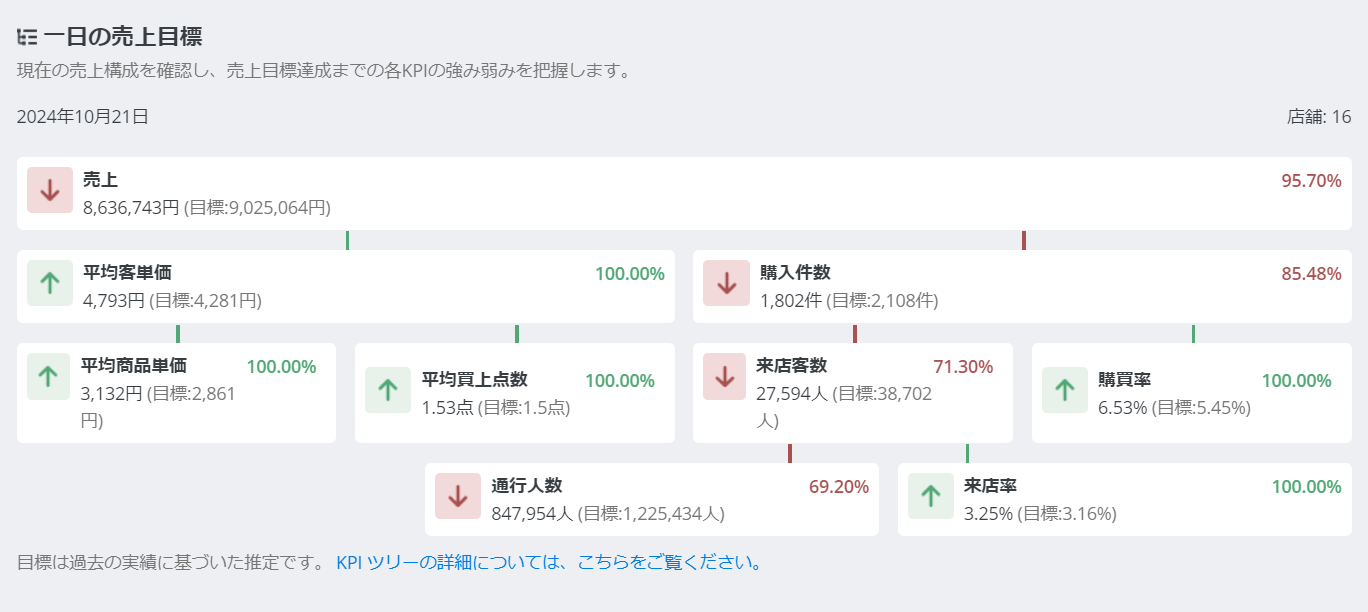
In the default home sales target chart, the sales progress KPI tree for 【Today】 【This Week】 【This Month】 is displayed.
Based on the target sales progress, each KPI target value required to achieve the goal is automatically calculated.
The calculation method for the target KPI is specified below.
KPI | How the Target Value Is Set |
|---|---|
Sales Target | If a sales target hasn't been imported, the same day of the week last year is set as the sales target, then calculated. Hourly sales targets are calculated by applying last year's sales progress to each month/weekday's sales target. (Example: if 70% of total sales were reached by 17:00 last year, 70% of the target period's sales target is auto-calculated.) |
Target Average Spend per Customer | Average of the same day of the week over the past 5 weeks |
Target Average Product Price | Average of the same day of the week over the past 5 weeks |
Target Number of Items Purchased | Target time series' [Target Average Spend per Customer ÷ Target Average Product Price] |
Target Number of Purchases | Target time series' [Sales Target ÷ Target Average Spend per Customer] |
Target Traffic | Average of the same day of the week over the past 5 weeks |
Target Storefront Passersby | Average of the same day of the week over the past 5 weeks |
Target Capture Rate | Target time series' [Target Traffic ÷ Target Storefront Passersby] |
Target Purchase Rate | Target time series' [Target Number of Purchases ÷ Target Traffic] |
Average of the same day of the week over the past 5 weeks | Calculated automatically |
That's all. If you have any questions or concerns, please contact us via the chat on the support page or at [email protected].
