
Here are some tips for quick data analysis using the KPI boxes on your dashboard. Use these for real-time evaluation and quick analysis while running your store.
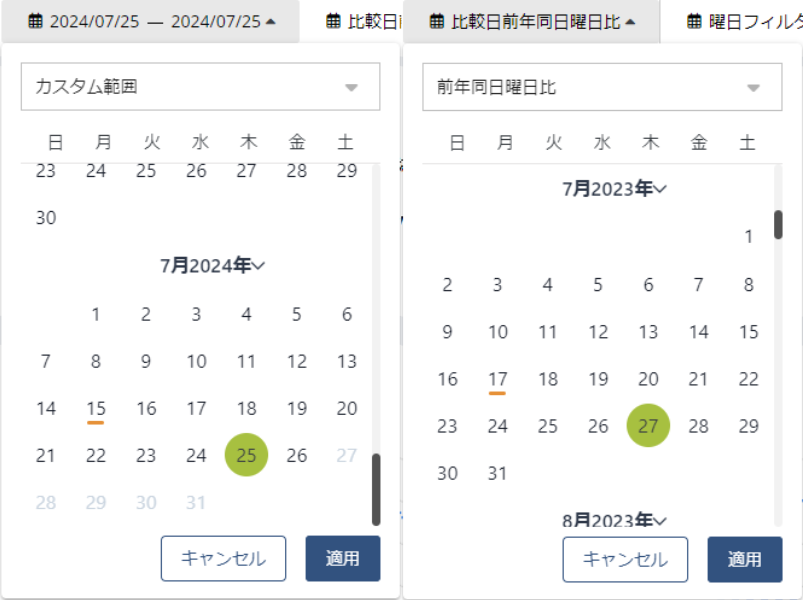
Filter the date to today, compared against the same day of the week last year.
Comparing against the same day of the week last year lets you compare performance under similar product mix and conditions.
*If you don't have data from last year, align conditions using a comparison against the same day of the week last week or last month instead.
Analyze what's driving sales by time slot, so you can course-correct your store operations right away.
・Tip: Sales = Traffic × Purchase Rate × Average Spend per Customer
Budget = Target Number of Purchases × Target Average Spend per Customer
Filter the date to Sunday or Monday as the start of the week, compared against the same day of the week last year.
Comparing against the same day of the week last year lets you compare performance under similar product mix and conditions.
*If you don't have data from last year, align conditions using a comparison against the same day of the week last week or last month instead.
You can see how KPIs change based on operations or weekly actions on a specific day of the week.
・Tip: New product arrivals — compared to last year's new arrivals/stock, did average spend per customer increase?
Setting a target number of customer interactions — compared to last year, did purchase rate/number of purchases increase?
Traffic = Storefront Passersby × Capture Rate
Busy hours (Power Hour) = hours when you can increase customer interactions and purchases
As the number of visiting customers increases, sales are also likely to increase.
You can evaluate overall performance by comparing the growth rate of visitors against the growth rate of sales.
(Example)
20xx, January 1
・Visitors: 2,000 vs. last year: 105%
・Sales: ¥1,000,000 vs. last year: 110%
Since sales grew at a higher rate than visitors, this can be considered stronger performance than last year.
Compare against other KPIs and products to identify the factors/actions that influenced sales.
This factor/action could become a success story for your store operations.
Purchase Rate (%) = Number of Purchases ÷ Traffic × 100
Actions that encourage a purchase — such as customer service, inventory management, or campaigns — will change this number.
Measuring by time slot lets you continuously evaluate your store's performance and purchase success using the purchase rate figure.
By understanding your store's current purchase rate and analyzing how it changes after an initiative, you can identify what's working.
Conversely, if you set a target purchase rate, you can also set a target number of purchases based on projected visitor count.
Average Spend per Customer = Sales ÷ Number of Purchases
This can also be thought of as the quality of what customers are buying.
This number changes based on the average price per item and the average number of items purchased.
If this number changes, one of those factors likely shifted — analyze either or both the product price and the number of items purchased.
Average Spend per Customer = Sales ÷ Number of Items Sold
Product price trends can reveal which products are selling well, such as new arrivals or sale items.
If this number changes, you can predict which product line is moving at your store and respond quickly with course corrections.
Explaining the brand and features of higher-priced items is also essential to selling them, so a rising product price can also indicate strong staff selling skills. Take a closer look at what's actually selling.
Average Number of Items Purchased = Number of Items Sold ÷ Number of Purchases
The average number of items purchased (bundle rate) reflects the quality of staff's suggestive selling and things like display sets.
This can also vary seasonally between summer and winter, so evaluate it in context.
During campaigns, keeping the average number of items purchased in mind lets you pursue a different path to maximizing sales than just traffic or purchase rate.
If you have any questions or concerns, please contact us via chat on the support page, or at [email protected].
