We will guide you through the item description and basic operation method of Flow.
We will explain the contents of each menu bar.
It is suitable for checking each KPI with a graph.
What is a KPI Box
We will explain the KPI box that displays the actual values of each KPI.
It is suitable for analyzing the correlation between KPIs and time series analysis.
Detailed Analysis
This is the feature introduction page for detailed analysis.
It is suitable for detailed analysis and comparison of the number of visitors.
About the Visitor Trends Report
It is suitable for measuring the trend of increase and decrease rates within the company.
Ranking
It is suitable for analyzing the details of the customer base.
Attribute Trends
It is suitable for discovering characteristics from store comparisons.
It is possible to create report materials with accompanying graphs.
Weekly Report
It is possible to set up an automatic behavior suggestion system.
Flow Assistant
This page introduces the Assistant that can automatically send messages based on the measured data.
It is possible to change user and store settings.
About the Settings Menu
We will explain the items in the settings menu.
It is possible to import and export data.
About Data Import
We will explain how to import various data.
Exporting Store Reports
Explanation of the export formats for store reports
Select filters for period, day of the week, store, and group to match the comparison target.
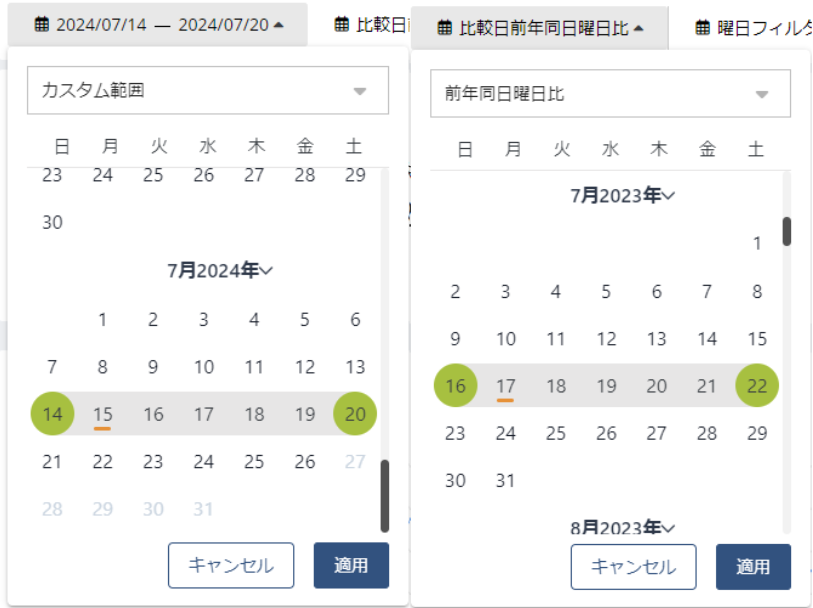
Select the target period (selected period) from the calendar or from the top box.
Similarly, select the period to compare with the selected period (comparison period).
※ If selecting only one day, click the same day twice.
Previous Period
Suitable for comparing the selected period with the same number of recent days.
Same Period Last Year
Suitable for comparing with the same day last year, such as holidays.
Year-over-year comparison for the same Sunday
Suitable for analyzing changes in similar situations as the previous year.

Suitable for collecting and comparing data by weekdays and holidays.

The total and average values of the selected stores are reflected in Flow.
Depending on the function, it is possible to compare by store.
You can sort store numbers in ascending or descending order using the ↓↑ buttons.

This will be grouped according to the company's preferences.
By categorizing by person in charge, region, etc., it is possible to improve analysis efficiency.
You can filter in detail with the ▷ button.

Clicking on each KPI box on the home screen will display a graph.
You can check the transition by time zone or date with the period selection filter.
☆ If you select a period of one day, the graph will be by time zone.

You can export images and data from the menu button attached to the graph on each page.
SVG Download
The background is transparent, making it suitable for material use.
PNG Download
The background is white, making it suitable for image printing.
CSV Download
It is downloaded in CSV format, making it suitable for use in EXCEL and Spread sheets.
For more detailed information, we have content available in the Help Center (Gleap), which you can check from the link below.